Short answer: a thickener has three coupled outputs — overflow clarity, underflow density and torque — and each has its own set of root causes. Diagnose the output that is off-spec before touching polymer dose or grade, because a change made on the wrong variable can move all three. The six recurring failure patterns — overflow clouding, underflow diluting, bed building, torque spiking, polymer waste and slow response to chemistry changes — each have a two-step check before dose is adjusted.

Tailings storage context. Not a photograph of a ChinaPAM project or a depiction of any specific thickener installation.
The three coupled outputs: what a thickener actually optimises
Every thickener optimises three numbers simultaneously, and they trade against each other:
- Overflow clarity (NTU or TSS): determines whether return water can go back to the process or to a dam. Flocculant governs fines capture in the settling zone.
- Underflow density (% solids or t/m³): determines paste quality, pump load, tailings storage life and water recovery. Bed residence time, rake speed and compression zone chemistry all contribute.
- Torque (% of rated or kNm): a real-time diagnostic signal related to bed condition, not a direct reading of it. Rising or falling torque is influenced by bed inventory, slurry rheology, underflow withdrawal rate and mechanical condition of the raking mechanism, so a trend on its own does not prove the bed is building or depleting — read it together with bed level, feed rate and underflow draw. Torque approaching the high-trip threshold is a late warning and should be treated as one whatever the cause turns out to be.
These three are coupled, which means a single adjustment can improve one output while degrading another, and the direction is not fixed in advance for every circuit. A change in polymer dose aimed at overflow clarity also changes floc structure and settling behaviour entering the compression zone, so underflow density can move with it either way. A change in rake speed aimed at underflow density changes both compression-zone behaviour and the shear the flocs see, so overflow clarity and torque can move with it too. Diagnose the out-of-spec output first, trace its root cause before adjusting any operating variable, and track all three outputs together at each step rather than assuming the other two held still.
Baseline data to collect before diagnosis
Effective diagnosis requires a baseline. If you do not have these numbers recorded for normal operation, collect them for at least a week before drawing conclusions:
- Feed rate (t/h dry solids) and feed slurry solids (%)
- Feed particle size distribution (after any ore or feed change, and at your site's defined monitoring frequency)
- Feed pH and water chemistry (ionic strength, hardness, and any variable associated with your ore body)
- Polymer make-down: solution concentration, mixing time and ageing time at the preparation point
- Polymer dose: L/h of solution, and kg active polymer per dry tonne of feed solids (equivalently mg/kg)
- Injection point location and flow conditions there
- Overflow turbidity (NTU) and TSS (g/L)
- Underflow solids (%) and, for paste applications, yield stress (Pa)
- Torque (% rated or kNm), trend over time, and the fraction of rated torque where the high-level alarm sits
- Bed level indicator reading (if installed)
- Feedwell dilution ratio: feed slurry diluted to what % solids before it enters the feedwell
Symptom matrix: eight failure modes with root causes
| Symptom | Check 1 (before dose change) | Check 2 (process variable) | Polymer action only if both clear |
|---|---|---|---|
| Overflow clouding suddenly | Feed tonnage or particle size changed? | Feedwell dilution ratio in spec? | Step dose up by 10% and hold for 30 min before further change |
| Overflow gradually deteriorating over days | Polymer make-down consistency? Fish-eyes or aged solution? | Water chemistry shift (pH, hardness)? | Re-screen charge/MW on current ore and water if make-down confirmed good |
| Underflow density dropping | Bed level falling? Feed rate or solids increased? | Rake speed set correctly for current bed depth? | Compression-zone chemistry may need coagulant or higher-charge flocculant |
| Torque rising steadily | Bed level rising? Feed rate spike or change? | Underflow pump keeping up with bed depletion rate? | Do not increase polymer without fixing bed draw-down first |
| Torque spiking unpredictably | Raking mechanism or shaft issue? | High-density slug from underflow pump cycling? | Stable torque is a process variable outcome, not a chemistry outcome |
| High polymer consumption, poor result | Injection point shear? Long line from make-down to injection? | Make-down concentration and mixing energy correct? | Move injection point; reduce shear before increasing dose or grade |
| Good batch test, poor thickener result | Batch test mixing vs real feedwell shear environment comparable? | Feedwell inlet velocity and turbulence within design? | Select grades for shear tolerance, not just settling rate in a batch cylinder |
| Slow response to dose changes | Hydraulic retention time from injection to settling zone? | Polymer solution ageing or concentration drift at the pump? | Allow one full HRT before judging a dose step; log dose change times |
Feedwell dilution and mixing
The feedwell is where polymer and slurry first meet, which makes conditioning at this point one of the first things to check when performance moves — before dose or grade, and without assuming it is the cause. The function of dilution is to reduce slurry density to a range where polymer can bridge particles before they reach the settling zone. Too little dilution means the polymer never contacts the particles uniformly; too much dilution increases hydraulic load and reduces residence time in the compression zone.
Injection point matters almost as much as dose. Polymer injected into a high-velocity line before the feedwell is exposed to shear that can degrade the molecular weight before any flocculation occurs. The requirement is therefore a tested compromise rather than a fixed position: choose the point that gives adequate distribution and contact time between polymer and slurry while avoiding destructive shear, and establish it by trialling candidate points on your own circuit and comparing overflow clarity and dose at each. High molecular weight APAM is more shear-sensitive than lower molecular weight products, so a grade change may require re-testing the injection point, not just changing the dial.
Polymer make-down and ageing
The make-down step is where most dose inconsistency originates, and it is rarely the first place operators look when performance drifts.
- Mixing time. Dry powder polymer needs enough mixing time to hydrate fully, and cutting it produces fish-eyes: incompletely hydrated particles that pass through a dose point without flocculating anything and inflate apparent consumption with no benefit. As a starting check only, and only where the supplier’s instructions permit it, 30 to 60 minutes is a range worth verifying against for high molecular weight APAM. The actual preparation requirement comes from the specific product TDS and from your own plant make-down validation, not from this range.
- Solution concentration. Higher solution concentration reduces effective molecular reach because chains are entangled. As a starting check where supplier instructions permit, 0.1–0.5% active is a range to verify against; the working target depends on molecular weight, the mixing energy available and the product TDS, confirmed by plant make-down validation.
- Ageing limit. An over-aged solution has been hydrating for so long that chain entanglement and partial degradation reduce activity. Use within the recommended window and track batch preparation time.
- Water quality for make-down. Hard water or high-ionic-strength water can inhibit hydration. If make-down water quality differs significantly from ore process water, that gap can explain why a grade that performs in a lab test underperforms in the plant.
Mineralogy, pH and water chemistry
No flocculant grade selection survives a change in ore source or water chemistry without re-verification. The variables that most often shift polymer performance between deposits or between seasons:
- Clay mineral content (particularly swelling clays): increases polymer demand and makes the compression zone more resistant to densification.
- pH. Most APAM products have an effective range and performance drops outside it. Acidic or alkaline circuits may need a different charge position or a coagulant pre-conditioning step.
- Ionic strength and hardness. High ionic strength compresses the polymer chain reach. Divalent cations (Ca²⁺, Mg²⁺) can bridge anionic polymer to particles in a way that either helps or, at high concentration, causes overdosing symptoms. Measure on the actual circuit water, not on tap water.
- Return water build-up. Recycled process water accumulates reagents, fine solids and ions over time. A programme that was calibrated on fresh water may need periodic re-calibration as return water chemistry shifts through the season.
This is why copper tailings and iron ore tailings often require different polymer programmes even at the same feed solids: the gangue mineralogy and the ore body water chemistry are different, and a grade selected for one cannot be assumed to transfer to the other without testing.
Static cylinder test for thickener screening
Before commissioning a pilot or changing grades on a running thickener, run a static cylinder test on slurry sampled directly from the thickener feed point:
- Sample at the actual feed point, not from the storage sump, to capture the true particle size and chemistry arriving at the feedwell.
- Dilute to the feedwell dilution ratio you run in the plant.
- Add polymer to the same mixing energy and contact time the feedwell provides (this is the hardest part to replicate; err on the side of gentler mixing).
- Record interface height at 1, 2, 5, 10 and 30 minutes. Also record supernatant turbidity at 30 minutes.
- Rank candidates by settling rate and supernatant clarity, not by interface height at a single time point.
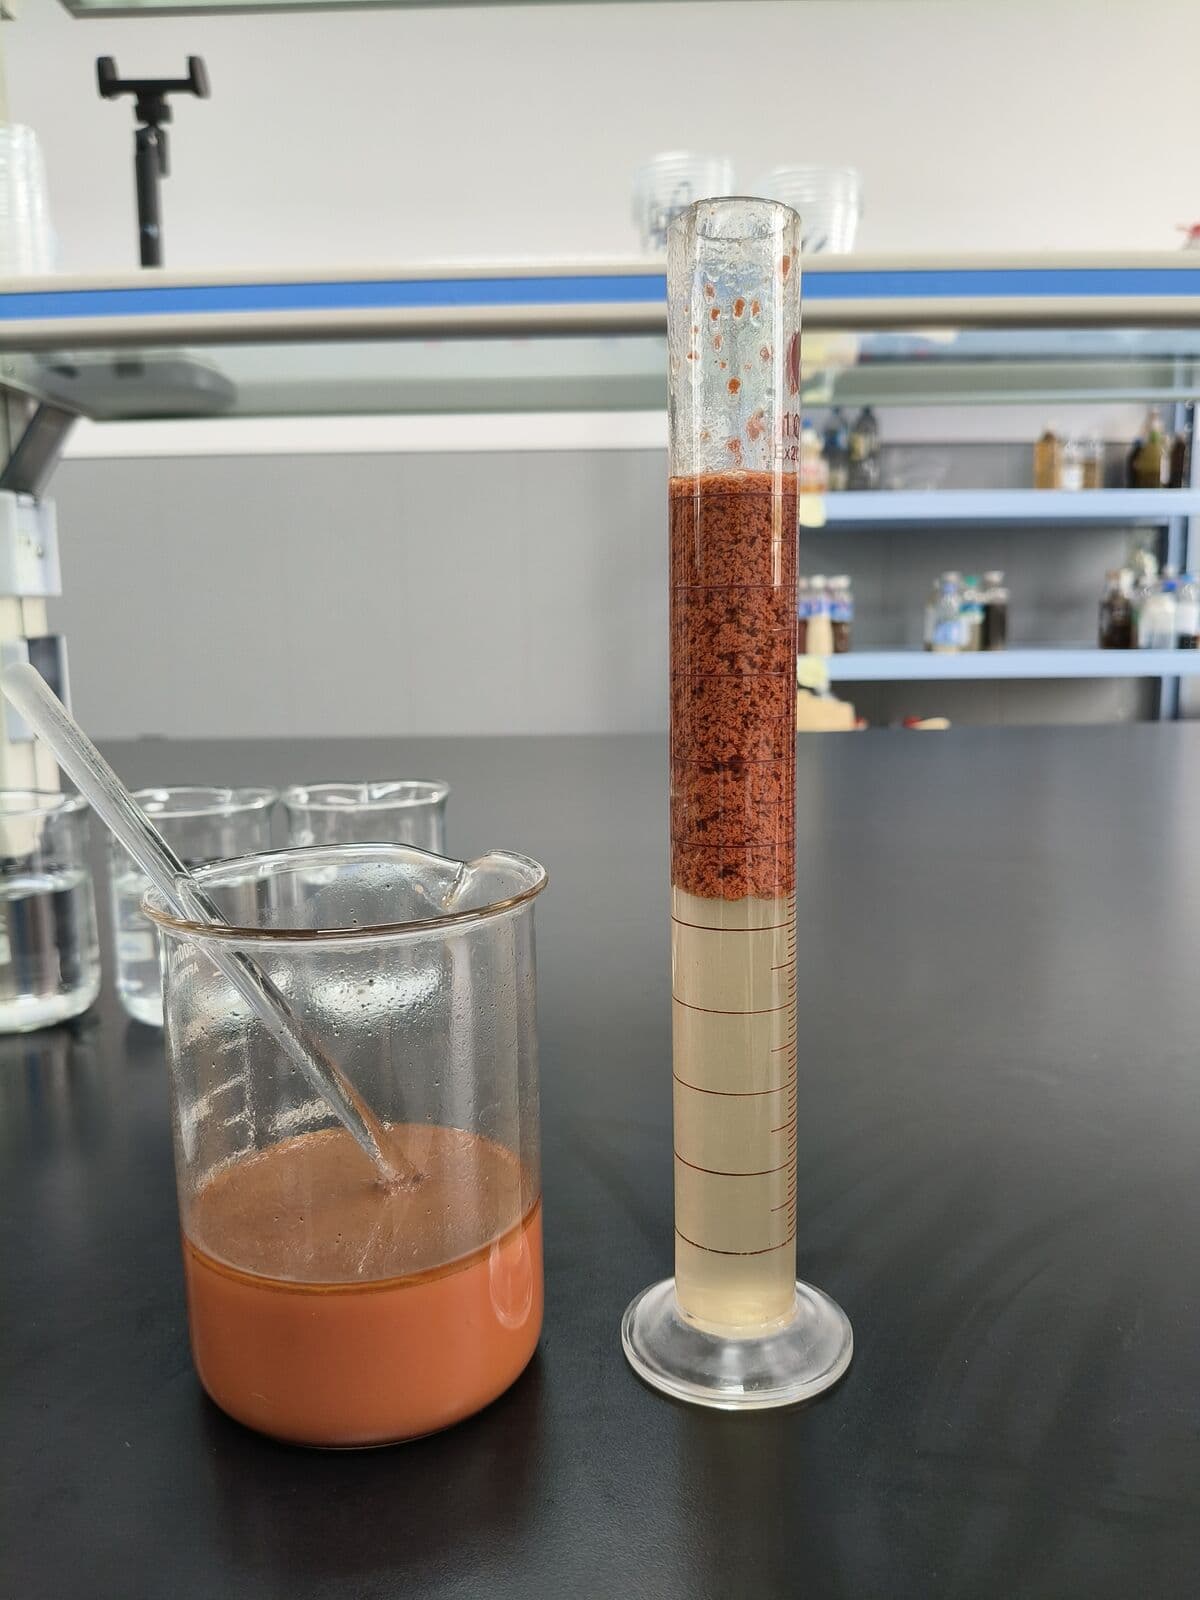
Before polymer addition: uniformly turbid tailings slurry in bench cylinder.
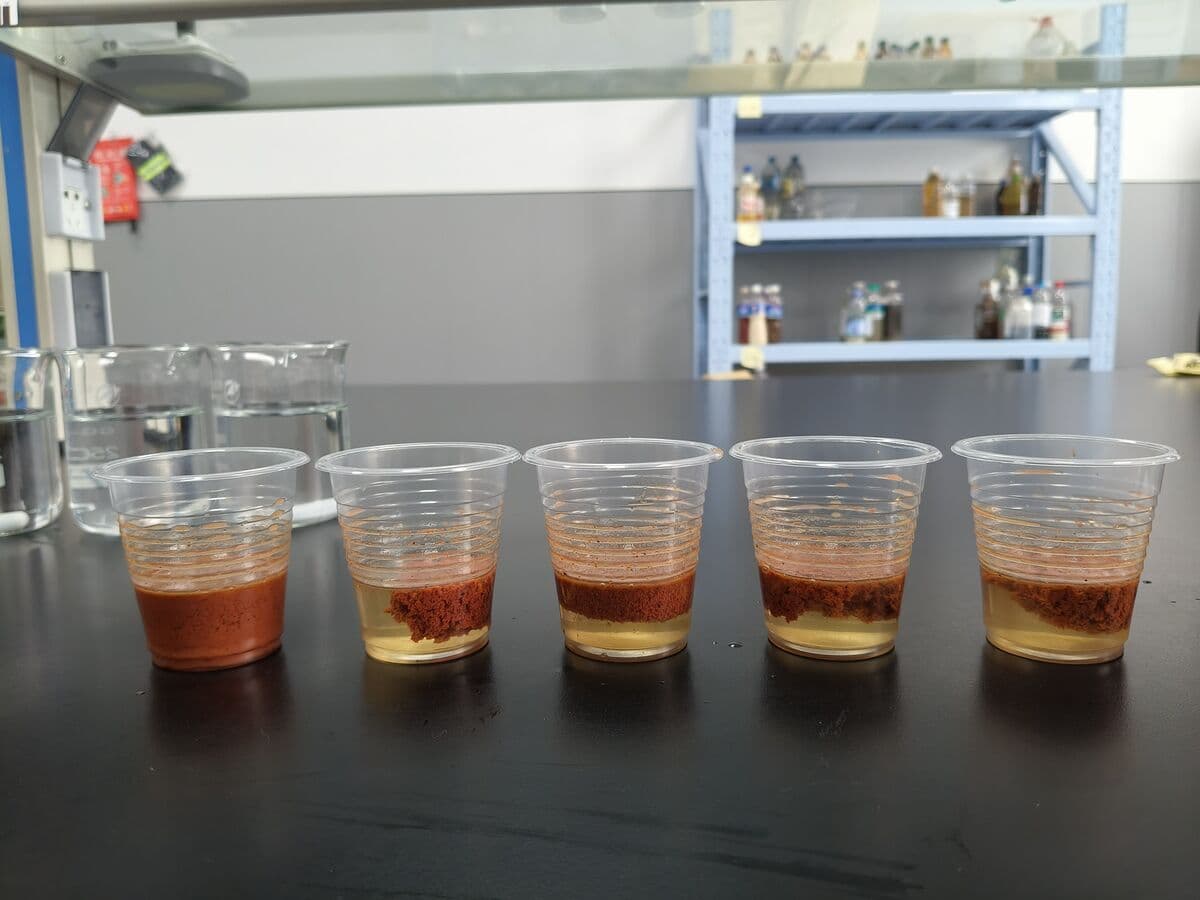
After conditioning: clear supernatant forming above settling solids. Bench comparison only — not evidence of thickener performance.
A dynamic confirmation test on a pilot thickener or a full-scale step trial is always required before committing to a grade change. The cylinder test ranks candidates and narrows the list; it does not replicate feedwell shear, bed compression or the hydraulic conditions of a running machine.
KPI and acceptance table
| KPI | How measured | Acceptance direction | Must not degrade |
|---|---|---|---|
| Overflow NTU | Turbidimeter on overflow stream | At or below current baseline | Return water quality or dam limits |
| Underflow solids (%) | Density meter or grab sample, dried weight | At or above current baseline | Downstream pump and pipeline design limits |
| Torque (% rated) | Continuous from thickener control system | Stable trend, no rising drift | High-level alarm threshold and raking event frequency |
| Polymer dose (kg active/dry t) | Solution flow × concentration ÷ feed dry solids | At or below current baseline at equivalent performance | Operating cost budget |
| Return water volume | Overflow flow meter | At or above current recovery | Water balance and process water supply |
What the tests prove and cannot prove
A cylinder screening programme and step trial can prove: that a polymer type and dose window improves overflow clarity and settling rate on your current ore and water; the approximate dose range required for stable operation at current throughput; and whether a candidate grade improves or degrades any of the five KPIs above under controlled conditions.
They cannot prove: that performance will hold when ore source changes; that a step trial result will be reproducible after seasonal return-water chemistry drift; that the compression zone behaviour at full-bed load matches the cylinder result; or that torque stability comes from polymer chemistry rather than from mechanical or hydraulic variables. A step trial of one week may not capture events that occur monthly or at end-of-season water recovery.
Buyer checklist before requesting quotes or grade changes
- Current baseline data for all five KPIs, at least two weeks of stable operation.
- Feed characterisation: particle size distribution, solids %, pH, ionic strength and clay mineral content.
- Make-down specification: current solution concentration, mixing time, ageing time and make-down water chemistry.
- Injection point description: pipe diameter, velocity, distance to feedwell.
- Feedwell dilution ratio and dilution water source.
- Ore source consistency: single source, blend or multiple pits? Any planned ore source changes during the trial window?
- Return water fraction in process water, and trend over the season.
- Torque alarm setpoint and typical torque at baseline.
- The specific KPI that is out of spec and the direction of deviation.
For adjacent topics see mineral tailings water treatment, PAM for mining tailings, polyacrylamide for mining tailings, copper mining applications, iron ore mining applications, and the jar test procedure.
Sources
- SNF, Tailings Management — supplier overview of flocculant use in tailings thickening. mining.snf.com/tailings-management
- SNF, Floquat product line — cited for context on cationic polymer applications. snf.com/industry/mining/product/floquat
- SNF, Oil Sands processing — cited for context on high-solids and high-clay tailings management. snf.com/industry/oil-gas/oil-sands
Third-party names and sources above are cited for reference and attribution. No figure or case from them describes a ChinaPAM project or result. Thickener performance depends on ore mineralogy, water chemistry, equipment design and operating conditions specific to your circuit; grade selection requires testing on your own material.
Send your thickener baseline data and get a diagnostic checklist
Share current KPIs (overflow NTU, underflow solids, torque), feed characterisation, make-down specification and the specific symptom that is out of spec. We will come back with a structured diagnostic path and a cylinder-test candidate list, with the acceptance criteria written down before any grade is named.
Quotation based on grade, quantity and destination · info@chinapolyacrylamide.com · WhatsApp +86 187-3759-0940