Polyacrylamide (PAM) prices fluctuate based on raw material costs, production capacity, and global demand. This guide provides 2026 market pricing, factors affecting cost, and strategies to optimize your PAM procurement budget.
2026 PAM Market Overview
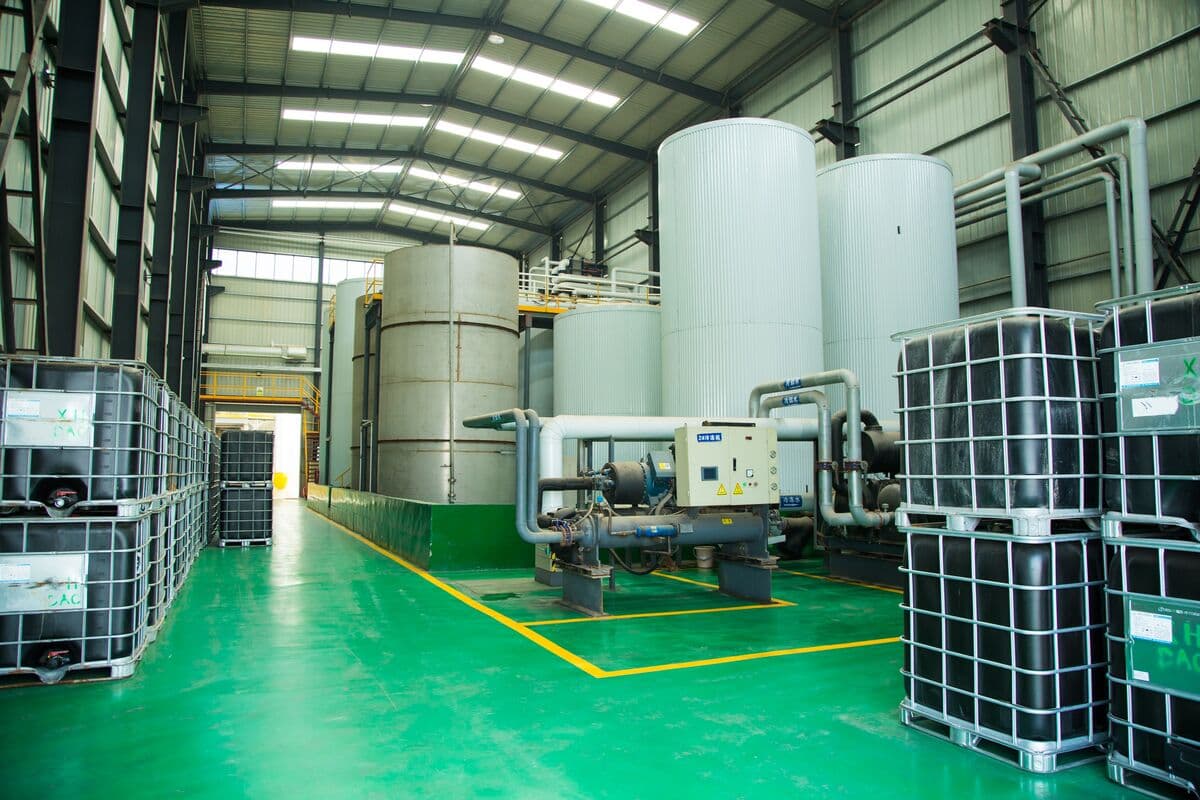
Production facility: storage tanks and processing systems
The global polyacrylamide market is valued at approximately $3.8 billion annually, with China accounting for 60% of production. PAM prices in 2026 remain relatively stable compared to 2024–2025, with slight upward pressure from:
- Rising energy costs in China (electricity for polymerization)
- Increased environmental compliance costs
- Strong demand from water treatment and mining sectors
For sourcing directly from Chinese manufacturers, see our supplier guide with MOQ and pricing details.
Current Price Ranges (2026)
| PAM Grade | Specifications | FOB China Price | Price Range |
|---|---|---|---|
| Anionic PAM (APAM) | 12M MW, 25% hydrolysis | $1,200–1,500 | ±$150 |
| Cationic PAM (CPAM) | 10M MW, 50% charge | $1,700–2,100 | ±$200 |
| Nonionic PAM (NPAM) | 8M MW, no charge | $1,400–1,800 | ±$200 |
| Oilfield Grade | PHPA, 20M MW | $2,200–3,000 | ±$400 |
| PAM Emulsion | 30% active polymer | $800–1,100 | ±$150 |
Factors Affecting PAM Price
1. Molecular Weight (MW)
Higher molecular weight PAM costs more due to more complex polymerization:
- Low MW (3–8M): Base price
- Medium MW (10–15M): +10–15% premium
- High MW (18–25M): +20–35% premium
2. Charge Density (for CPAM)
Cationic charge increases production complexity. See our charge density explained article for technical details:
- Low charge (10–20%): Base price
- Medium charge (40–60%): +15–25% premium
- High charge (70–80%): +30–50% premium
3. Order Volume
Bulk orders receive significant discounts:
| Order Volume | Discount |
|---|---|
| 1–5 MT (trial) | 0% (list price) |
| 5–20 MT | 5–8% |
| 20 MT (FCL) | 8–12% |
| 100+ MT/year (contract) | 15–20% |
4. Packaging
Standard 25 kg bags are included in base price. Custom packaging (jumbo bags, specific labeling) adds 2–5% to cost.
5. Shipping Terms
- FOB (Free on Board) — You pay shipping; lower base price
- CIF (Cost, Insurance, Freight) — Seller pays shipping; higher base price
- DDP (Delivered Duty Paid) — Seller handles all costs; highest price
Cost Comparison: PAM vs Alternatives
Treatment Cost Per m³ of Water (2026)
PAM is 60–75% cheaper than traditional inorganic coagulants.
Need PAM for your project?
Free sample + jar test report. WhatsApp: +86 187-3759-0940
Raw Material Cost Drivers
Acrylamide monomer (AM) is by far the largest cost in PAM production — typically 55-65% of finished polymer cost. Understanding AM price dynamics is essential for predicting where PAM prices are heading.
Acrylamide is produced by hydrating acrylonitrile (ACN) using either copper-based catalysts or biocatalysts (nitrile hydratase enzyme). ACN itself is derived from propylene via the SOHIO process, which means AM and PAM prices ultimately track propylene markets.
| Cost Component | Share of PAM Cost | 2026 Trend |
|---|---|---|
| Acrylamide monomer (50% solution) | 55-65% | Stable, $1,150-1,350/MT |
| Cationic comonomer (DMDAAC) | 10-25% (CPAM only) | +5% YoY, supply tightness |
| Initiators & chain transfer agents | 3-5% | Stable |
| Energy (electricity, steam) | 8-12% | +3-5% in China (industrial tariff hikes) |
| Labor & overhead | 5-8% | +2-3% YoY |
| Packaging (kraft bags, PE liner) | 3-5% | Stable |
| Environmental compliance | 2-4% | +10-15% as China tightens emission rules |
AM monomer pricing in China traded between $1,100 and $1,400/MT through 2024-2025. Watch crude oil and propylene benchmarks (CFR China propylene) as a 4-6 week leading indicator of AM price moves. A $100/MT move in AM typically passes through to PAM as a $55-65/MT change in finished product.
Price Breakdown by Grade and Specification
| Specification | Standard MOQ | Target Application | FOB China $/MT |
|---|---|---|---|
| APAM 8-10M MW, 20% hyd. | 500 kg | Sand washing, basic clarification | $1,050-1,300 |
| APAM 12-15M MW, 25% hyd. | 500 kg | General industrial WWT | $1,200-1,500 |
| APAM 18-22M MW, 28% hyd. | 1 MT | Mining tailings, high-rate thickeners | $1,500-1,900 |
| APAM 25-28M MW, 30% hyd. | 1 MT | EOR polymer flooding | $2,200-3,000 |
| CPAM 8M MW, 20% charge | 500 kg | Light industrial water | $1,300-1,650 |
| CPAM 10M MW, 50% charge | 500 kg | Municipal sludge dewatering | $1,700-2,100 |
| CPAM 12M MW, 70% charge | 500 kg | Centrifuge, heavy organic sludge | $2,150-2,650 |
| NPAM 8M MW | 500 kg | Acidic / low-pH wastewater | $1,400-1,800 |
| Emulsion APAM 30% active | 1 MT | Friction reducer, fast-make-up plants | $850-1,150 |
| regulated-use document review APAM, regulated water | 1 MT | Potable water clarification | $1,800-2,400 |
Volume Discount Tiers (Detailed)
Annual volume drives the deepest discounts because production scheduling and raw material procurement become more efficient. Spot orders pay list price; planned annual contracts unlock 12-18% off.
| Annual Volume | Order Pattern | Discount | Payment Terms |
|---|---|---|---|
| < 5 MT | Spot, 1-2 orders/year | List price | 100% T/T before shipment |
| 5-20 MT | Spot, 2-4 orders/year | 3-6% | 30/70 T/T |
| 20-60 MT | Quarterly FCL | 7-10% | 30/70 T/T against B/L copy |
| 60-200 MT | Monthly FCL, annual contract | 10-14% | L/C 60 days or T/T 30/70 |
| 200-500 MT | Multiple FCL/month, annual | 14-18% | L/C 90 days or T/T net 30 |
| 500+ MT | Strategic partnership | Custom (16-22%+) | Negotiated, includes price-lock clauses |
Total Cost of Ownership Calculation
Unit price tells less than half the story. A cheap PAM that needs 30% higher dosage often costs more delivered. Use this framework to calculate true cost per cubic meter or per ton dry solids treated:
TCO per m³ treated water:
= (Polymer price $/MT × Dosage mg/L ÷ 1,000,000) + Freight $/m³ + Storage $/m³ + Handling $/m³
Example A — Cheap polymer:
$1,100/MT × 4 mg/L ÷ 1,000,000 = $0.0044/m³ chemical
+ freight $0.0008/m³ + storage $0.0003/m³ = $0.0055/m³ total
Example B — Better polymer:
$1,500/MT × 2.5 mg/L ÷ 1,000,000 = $0.00375/m³ chemical
+ freight $0.0008/m³ + storage $0.0003/m³ = $0.00485/m³ total
Result: Better polymer is 12% cheaper per m³ despite costing 36% more per MT.
On a 30,000 m³/d plant, that 12% gap is roughly $7,300/year — far more than the price difference matters in isolation. Always run the math on dosage × price, not just price.
FAQ: Pricing
Why are quotes from different Chinese suppliers so far apart?
Three reasons. First, real manufacturers quote actual production costs while traders quote whatever margin they think they can get. Second, low quotes often hide low solid content (85% vs the 90% spec) — meaning you pay for water. Third, residual monomer levels: a polymer at 0.05% residual costs more to produce than one at 0.15%, and that affects safety compliance for regulated water work. Always compare on solid content and residual monomer alongside price.
Are emulsion polymers really cheaper than powder?
Per kg of finished product, yes — emulsion is typically 35-45% cheaper. But emulsion is only 30-40% active polymer (the rest is oil and water). On an active-polymer basis, emulsion runs 5-15% more expensive than powder. The decision is logistical: emulsion dissolves in 2 minutes, powder takes 60-90 minutes. For continuous high-volume operations (fracking, large WWTPs), emulsion saves labor and equipment cost. For batch operations, powder is cheaper.
Can I lock in pricing for 12 months?
Yes for stable raw material conditions. We offer 6-month firm pricing on annual contracts at 200+ MT. For 12-month locks we typically include a price adjustment clause tied to AM monomer index — if AM moves more than ±8%, prices adjust pro-rata. This protects both sides from major raw material moves while keeping the contract simple.
Does shipping cost vary with PAM type?
Slightly. Powder PAM ships at 0.7-0.9 g/cm³ bulk density — a 20ft container holds 20 MT and weighs out before it cubes out. Emulsion ships in 1,000 L IBCs at about 1.05 g/cm³ — same container holds about 21 MT. Effectively no cost difference per kg. The exception is hazardous goods routing for some emulsion grades — adds $200-500/container.
What if AM monomer prices spike during my contract?
For spot orders we honor the quoted price for 14 days from issue. After that we requote. For annual contracts with price-lock clauses, the indexed adjustment formula handles it automatically. The most volatile period historically was 2021-2022 when AM prices nearly doubled — anyone with a fixed-price annual contract from late 2020 was very happy. Anyone without one paid 60% more by mid-2022.
Annual Budget Calculation
To estimate your annual PAM budget:
Step 1: Calculate Annual Consumption
Annual PAM (kg) = Daily Dosage (mg/L) × Daily Flow (m³) × 365 days ÷ 1,000,000
Example: 2 mg/L × 10,000 m³/day × 365 ÷ 1,000,000 = 7.3 MT/year
Step 2: Calculate Annual Cost
Annual Cost = Annual Consumption (MT) × Unit Price ($/MT)
Example: 7.3 MT × $1,500/MT = $10,950/year
Cost Optimization Strategies
Strategy 1: Negotiate Annual Contracts
Commit to 100+ MT/year and negotiate 15–20% discounts. This locks in pricing and ensures stable supply.
Strategy 2: Optimize Dosage
Run jar tests to find the minimum effective dosage. Reducing dosage by 20% saves $2,000–5,000/year for a typical plant. Our dosage calculation guide walks through the process step by step.
Strategy 3: Use Emulsion for Smaller Plants
PAM emulsion (30% active) costs less per active kg and dissolves faster, reducing labor. Ideal for plants treating <5,000 m³/day. Compare emulsion vs powder forms to decide which is right for your operation.
Strategy 4: Bulk Purchasing Consortium
Multiple small plants can pool orders to reach FCL (20 MT) minimums and negotiate better pricing.
Price Trends & Forecast
Based on 2024–2026 data:
- 2024: APAM $1,100–1,400/MT (post-pandemic recovery)
- 2025: APAM $1,200–1,500/MT (stable, slight increase)
- 2026: APAM $1,200–1,500/MT (current, stable forecast)
- 2027 Outlook: Expect 3–5% increase due to energy costs and environmental compliance
Hidden Costs to Consider
- Shipping & Logistics: $200–500 per shipment (varies by destination)
- Customs & Import Duties: 0–15% depending on country
- Storage & Handling: $50–100/MT/year for warehouse space
- Quality Testing: $100–300 per batch (optional but recommended)
- Dosing Equipment: $5,000–20,000 one-time investment
Sourcing Tips to Get Best Prices
- ✓ Request quotes from 3–5 suppliers (ChinaPAM, Xinqipolymer, Chinafloc)
- ✓ Specify exact specs (MW, charge density, solid content)
- ✓ Ask for volume discounts and payment term flexibility
- ✓ Request free samples for testing before committing
- ✓ Negotiate annual contracts for 15–20% savings
- ✓ Consider FOB pricing to reduce total cost
- ✓ Ask about seasonal pricing (lower in off-season)
Also check our guides for bulk wholesale purchasing and regional supplier options for Australia.
Get Competitive PAM Pricing
Share your annual volume and specifications. We'll provide a detailed quote with volume discounts and payment options.
Recommended Product Grades
For the application discussed above, these are the polyacrylamide grades we ship most often:
Not sure which is right for you? Try our PAM Selector tool or request a quote.
Standards Note
According to ICIS-style chemical-market practice, polymer price comparisons should separate raw-material movement, freight, currency, and order volume.
Per ICC Incoterms practice, FOB and CIF quotes cannot be compared without adding freight, insurance, destination handling, and local duties.