
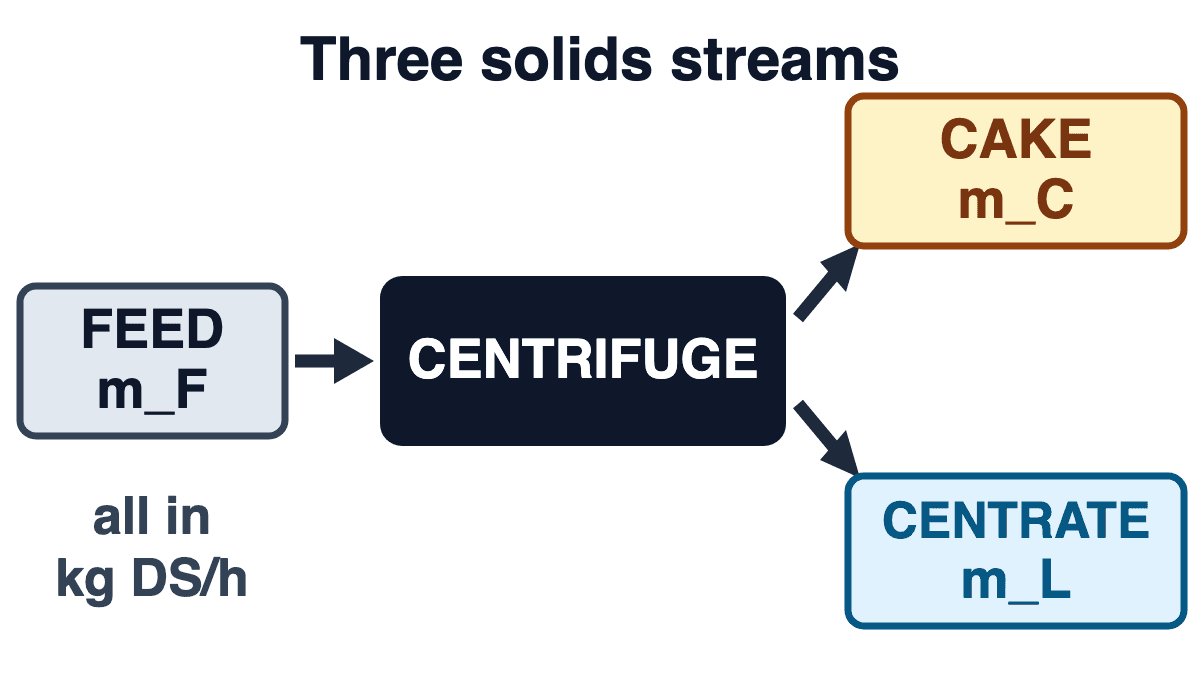
A drier cake is not automatically a better dewatering result. Cake dry solids and solids capture are two different outcomes, and a polymer or machine change can improve one while quietly degrading the other. Compare runs at the same feed dry-solids loading under a declared steady two-outlet boundary, and a drop in the cake solids rate shows up as a rise in the centrate solids rate. Wet-cake mass depends on both the captured solids rate and the dry fraction, so work it out from both rather than reading dryness alone. Before declaring a trial the winner, close a feed, cake and centrate balance on one declared solids basis and read both numbers together.
Why one number cannot rank a trial
A decanter centrifuge has two product outlets and both carry solids. Manufacturer process literature treats this as a balancing act rather than a single optimum: conveying speed and pond depth are presented as adjustments for finding a workable balance between liquid clarity and solids dryness
(Alfa Laval, Decanter Centrifuge Solutions, ALDEC section; no publication date stated in the document). If the machine is adjusted along a trade-off, a comparison that reads only one end of it cannot say which polymer or setting was better.
The failure mode looks like success: wet cake tonnage falls, the cake feels drier, the trial is written up as a saving. What may actually have happened is that fewer kilograms of dry solids left in the cake at all. Lower wet-cake mass bought by losing solids to the centrate is not an improvement, just a transfer of the same solids to the other outlet. Where those solids then go is a site-specific question — some works return centrate upstream, others treat, discharge or recover it under their own consent limits — so check the actual routing before you judge what the extra loss costs you.
Define the three streams and the boundary first
Draw the boundary before measuring anything. For the balance below:
- Feed: the stream entering the declared boundary. State whether it is raw or conditioned sludge. A conditioned-feed boundary is usually cleaner for closing a balance; if you also want dose per tonne of raw solids, record raw feed separately rather than switching boundaries mid-calculation.
- Cake: the solids discharge.
- Centrate: the clarified liquid outlet, which still carries solids.
- Other streams and inventory: wash and flush periods, additional solids inlets or outlets, and solids accumulating or discharging inside the machine. Declaring these out of scope does not remove them. If a flow actually crosses your boundary, either put it in the balance, or choose and verify an operating interval and boundary where it does not cross — and note that accumulation is not an outlet at all. If it builds up or discharges during your measurement, the steady three-stream form does not apply: inventory change equals all inputs minus all outputs. Leaving a contribution out is only legitimate when you can show from available evidence that it is small relative to what you are trying to decide.
Then declare one tracked solids quantity and keep every stream on it. EPA Methods 160.2 and 160.3 separate the residue retained on a glass-fibre filter from total residue measured on an evaporated aliquot, which is the sum of suspended and dissolved material. Those are water and waste methods: they explain the distinction, but they do not validate a test for concentrated sludge or dewatered cake, so have the laboratory pick a method appropriate to each actual matrix. Pairing feed and cake TS with centrate TSS can leave dissolved or additive residues out of one side only, making the balance appear to close when it has not. Reconcile methods, units and dissolved-solids accounting before any number enters a capture calculation.
Conditioning chemicals belong in that decision. Active polymer, carrier and surfactant residues and salts can all contribute to a laboratory dry residue depending on composition and method, and wet product mass is not dry-solids mass. Make-down water changes hydraulic and wet-mass flows even where its solids contribution is negligible. In a real trial, account for these on your declared analytical basis, or show with the evidence you have that their contribution is small against the uncertainty you are working to; a simplifying assumption that they can be ignored belongs in a worked illustration, not in a plant balance you intend to act on. Either way, do not deduct a guessed carrier fraction or an unverified active percentage.
The balance, derived
These are our own conservation equations, written out so you can check them — not a quotation from a standard, a manufacturer or any ChinaPAM trial. They hold under stated conditions: steady state over the measured period, one consistent tracked dry-solids basis, and no unaccounted solids input, outlet or accumulation.
- mF = mC + mL — feed, cake and centrate dry-solids mass rates, all in kg DS/h on the same basis.
- Capture (%) = 100 × mC / mF = 100 × (1 − mL / mF)
- m = Q × C when flow Q is in m³/h and the matching concentration C is in kg DS/m³. If your concentration is a wet-mass fraction instead, you also need a measured stream density; do not assume every sludge, cake and centrate sits at 1,000 kg/m³.
- Wet-cake mass rate = mC / xC, where xC is cake dry solids as kg DS per kg wet cake (25% is 0.25).
Three different things get called "capture", and they are worth keeping apart:
- Direct capture from independently measured feed and cake rates: mC / mF. This needs no centrate measurement at all.
- Loss-derived capture from feed and centrate, 1 − mL / mF, which is only equal to the first under the declared two-outlet steady-state boundary.
- Three-stream closure: measuring all three independently and checking whether they reconcile. This is the only one that tests the boundary assumption rather than relying on it.
So if you obtain cake solids by subtracting measured centrate from measured feed, the balance closes by construction and proves nothing. Closure is evidence only when the cake output is measured independently and then compared against the other two streams. Flow and concentration periods must cover the same window, allowing for residence lag, with samples representative of it.
What the trade-off looks like in numbers
The two cases below are hypothetical arithmetic illustrating the method — not measured results, targets or anyone's plant data. Both assume 200 kg DS/h feed on the same declared basis over representative steady periods, only cake and centrate carrying the tracked solids out, no accumulation or other losses, and soluble and additive dry residues treated as negligible for the illustration, or else accounted for consistently on that same basis in every stream. That simplification is acceptable here precisely because the example is hypothetical.
| Quantity | Case A | Case B |
|---|---|---|
| Feed dry solids, kg/h | 200 | 200 |
| Cake dry solids, kg/h | 180 | 170 |
| Centrate dry-solids loss, kg/h | 20 | 30 |
| Solids capture, % | 90 | 85 |
| Cake DS, % of wet mass | 18 | 25 |
| Wet cake, kg/h | 180 / 0.18 = 1,000 | 170 / 0.25 = 680 |
Read on cake dryness alone, B wins by seven percentage points and ships 320 kg/h less wet cake, 32% less than A. Read on capture, B is 5 percentage points worse and sends 10 kg/h more dry solids out with the centrate. Note that the two cases differ in both dryness and capture, so the 320 kg/h is not a dryness effect alone: part of it is simply that 10 fewer kilograms of dry solids per hour reported to the cake. Both readings are correct, and neither settles the question by itself. Whether B is acceptable depends on where its centrate actually goes and what limits apply there — not on which column looks better.
The illustration checks solids closure only: inlet wet mass and centrate liquid flow are not given, so no water balance is claimed, and it says nothing about cost, compliance or grade choice. For the cost side, our municipal sludge dewatering guide works through a comparison assuming full and equal capture — the assumption this balance exists to test rather than inherit.
Conceptual mass balance—not measured results. All three rates are kg DS/h on one consistent, declared solids basis. The three-stream form shown here holds only at steady state over the measured period, with no unaccounted solids inlet or outlet and no accumulation inside the machine; capture (mC/mF) and cake dryness (xC) are separate quantities, set out in the text above.
A comparable trial sheet
Record all of the following per run to make two trials comparable. This is our own checklist, not a published protocol.
- Matched feed: same source and comparable characteristics, with feed solids measured per run rather than assumed constant.
- Flow and load: for the liquid streams, volumetric flow with its matching concentration, over paired windows that overlap the sampled material. For cake, an independently measured mass flow with its dry fraction where that is practical — weigh it rather than converting a volume you would need a density to trust.
- Machine conditions: throughput, bowl and conveying settings, pond depth, so a polymer change is not credited for a machine change.
- Polymer basis: product and active-polymer basis, make-down concentration, dilution water, and the boundary you dosed relative to.
- Both outcomes: cake dry-solids fraction and measured centrate solids loss, reported together.
- Closure: the independently measured cake output, the balance discrepancy, and your laboratory methods and units.
Resist the single-number ranking. A trial with independently measured feed and cake can still state a capture figure without centrate data; what it cannot do is verify the loss and closure check, so the boundary assumption behind that figure stays untested and the paired-trial dossier is incomplete. Say which of the three you have. For grade direction once the method is settled, see our cationic PAM for sludge dewatering guide, and for dose arithmetic on a stated basis, the dosage calculation guide.
Comparing dewatering polymers on your own numbers
If you have feed, cake and centrate measurements on a declared solids basis, send them with your machine conditions and we will discuss conditioning options against that balance rather than against a cake percentage alone. Tell us what you are dewatering.
FAQs
Is a drier cake always the better result?
No. Wet-cake mass rate is mC / xC, so at a fixed captured dry-solids rate mC, raising the cake dry fraction xC does reduce wet-cake mass. That is the clean comparison. When mC changes too, both quantities move, so calculate wet-cake mass from both and assess capture as its own result — a lower wet tonnage can be partly or wholly a capture effect, as in the illustration above. Judge both outcomes together, against the limits that apply wherever your centrate actually goes.
Can centrate turbidity or an NTU reading give me capture?
Not by itself. Capture is dimensionless — a fraction or percentage — calculated from compatible dry-solids mass rates, which are the quantities carrying kg DS/h. Turbidity does not give you a mass rate, so it cannot produce the centrate solids load for a loss or closure check. It can be a useful routine indicator between proper measurements. Note also that if you have independently measured feed and cake rates, you can state capture directly from those two without a centrate figure — you just cannot verify the balance that way.
Why can't I just mix TS and TSS values in the equation?
Because they measure different things under their stated methods: TS is a dry residue that can include dissolved material, TSS the suspended fraction retained (EPA Methods 160.2 and 160.3). Feed and cake TS alongside centrate TSS can omit residues from one side only, so the balance can appear to close while the capture figure is wrong. Choose one tracked quantity, state the methods, keep every stream on it.