
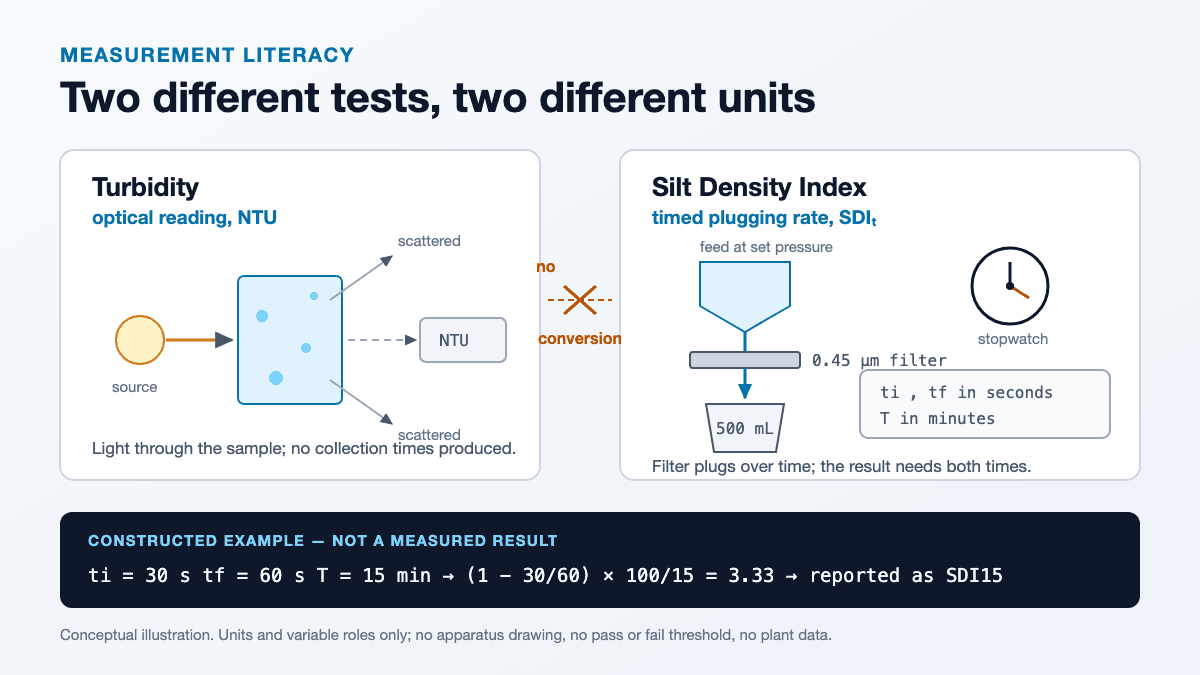
Short answer: turbidity and SDI are not two scales for the same thing. Turbidity is an optical reading; SDI is a timed filtration result — how fast a 0.45 µm membrane filter plugs under a set pressure. The manuals cited here contain no formula converting NTU into SDI, so a low turbidity figure cannot stand in for an SDI number, and an SDI number cannot be reproduced without the two collection times behind it. This guide shows the calculation, works three arithmetic examples by hand, and sets out what a test report must state before two trial results can honestly be compared.
What each number actually measures
DuPont’s RO/NF technical manual lists both in the same table of fouling indices, which makes the contrast easy to see. Turbidity, in that table, is an optical characteristic: the instrument reports how much light the sample diverts or absorbs instead of letting it pass straight through, and the material responsible is the suspended and colloidal content — clays, silts, fine organic and inorganic particles, microorganisms. The Silt Density Index is built on a different observation entirely. It is derived from how quickly a 0.45 µm membrane filter loses throughput while water is pushed through it at a fixed applied gauge pressure. [1]
One instrument reads how the sample interferes with a light path; the other watches a specific filter lose throughput over time. Different physics, different units, overlapping but not identical material — which is why both appear on membrane feedwater log sheets rather than one replacing the other.
The apparatus is what a report has to pin down. In that method the filter is 0.45 µm, the pressure regulator is set to 207 kPa (30 psi, about 2.1 bar), the time to collect 500 mL is recorded at the start and again after the selected elapsed flow period, and water temperature and pressure are checked as each sample is collected. [1] Change the filter rating, the pressure or the collected volume and the number can no longer sit in the same column as the previous one.
The formula, and the two kinds of time in it
The calculation in that manual is:
SDIT = (1 − ti / tf) × 100 / T
- T — total elapsed flow time, in minutes (commonly 15)
- ti — initial time to collect 500 mL, in seconds
- tf — time to collect 500 mL after the elapsed period T, in seconds
The common reading error is treating those three numbers as the same kind of time. ti and tf are stopwatch durations for filling the same 500 mL volume, in seconds. T is how long water has been running through the filter before tf is taken, in minutes. [1] The ratio ti/tf is dimensionless, so building it from seconds is fine — but putting T in seconds puts the result out by a factor of 60.
The subscript records which elapsed period the number came from. SDI15 means T was 15 minutes; a result from a shorter period is a different number with a different subscript, and the two cannot be swapped in a trend.
Three worked examples, done by hand
These are constructed arithmetic examples. The time values are chosen to demonstrate the calculation. They are not ChinaPAM measurements, not a product comparison, not a before-and-after polymer trial, and not acceptance limits for any plant.
Example A — a straightforward SDI15
Assume ti = 30 s, tf = 60 s, T = 15 min.
- Ratio: 30 / 60 = 0.5
- Plugging fraction: 1 − 0.5 = 0.50
- Index: 0.50 × 100 / 15 = 3.33
Reported as SDI15 = 3.33 under the assumed conditions. Whether that is acceptable belongs to the applicable membrane and project requirements, not to this arithmetic.
Example B — a second independent illustration
Assume ti = 30 s, tf = 45 s, T = 15 min.
- Ratio: 30 / 45 = 2/3
- Plugging fraction: 1 − 2/3 = 1/3
- Index: (1/3) × 100 / 15 = 100 / 45 = 2.22
Carry the exact fraction into the last step rather than rounding it first. Rounding 1/3 to 0.33 before multiplying introduces error into the reported figure; the division is only performed once, at the end.
A standalone illustration, deliberately not example A treated with a polymer — no improvement percentage should be calculated between the two. Two numbers become a comparison only when they share a sampling point, a feed condition and a test basis.
Example C — when the arithmetic is not a valid result
Assume ti = 30 s, tf = 150 s, T = 15 min.
- Ratio: 30 / 150 = 0.2
- Plugging fraction: 1 − 0.2 = 0.80
- Raw arithmetic: 0.80 × 100 / 15 = 5.33
Stop at step 3. The manual carries a note on this method: 1 − (ti/tf) should not exceed 0.75, and if it does, a shorter time should be used for T — the 5 or 10 minute collections in the procedure. [1] At 0.80 the filter has plugged too far for this elapsed period to describe it, so 5.33 is arithmetic, not a valid SDI15 for the described method.
Two things must not happen next. The 5.33 cannot be published as SDI15; and it cannot be rescaled or relabelled into SDI5 or SDI10. A shorter-period result comes from the collection actually made at that shorter period, with the subscript set accordingly. This is a method-validity condition in the cited manual, not a plant pass-or-fail line.
What a comparable test report has to state
An argument about a pretreatment trial result is sometimes not an argument about chemistry at all, but about two numbers that were never comparable in the first place. Membrane feedwater practice keeps SDI15 and turbidity as separate logged parameters, alongside the feed condition and operating data they were taken under. [2] The table below is our own reporting aid built on that principle; it is not a manufacturer-prescribed form and sets no threshold values.
| Field | What to record | Why it affects comparison |
|---|---|---|
| Sample location | The actual post-treatment or post-filtration sampling point, and how it relates to the RO feed. | A jar-test supernatant and the real RO feed are different samples. |
| Sample identity and time | Feed source, collection time and the process condition running at the time. | A different feed condition can block attribution to any polymer grade. |
| Chemical trial basis | Exact grade and dose basis, stock solution preparation, coagulant condition and separation configuration. | Keeps the changed variable visible; several silent changes make the result unattributable. |
| Test basis | Filter specification, applied pressure, temperature, the 500 mL collection volume and the instrument or method identity. | Different test conditions make raw scores incomparable even on the same water. |
| Time inputs | ti in seconds, tf in seconds, and elapsed T in minutes. | Keeps collection duration distinct from elapsed filtration duration, and lets anyone recompute the result. |
| Validity and result | The plugging fraction, the index with its actual subscript, and separately measured turbidity. | Shows whether the number met the method note, and prevents one unit being substituted for the other. |
| Acceptance owner | The applicable membrane, system or project requirement, and who agreed the decision. | A method explanation cannot create an acceptance threshold; that belongs to the project. |
Note the last row. Published feedwater guidance ties indicator expectations to a specific water type and membrane specification rather than issuing one global number, which is why manufacturer tables differ by feed category. [2] Take the figure that applies to your membranes and your project from the documents that govern them.
What neither number tells you
Both indices describe particulate and colloidal behaviour. Neither identifies what is in the water chemically. A turbidity reading cannot produce the two collection times the SDI calculation needs, and nothing in these sources offers a conversion between them. [1]
The misreading runs the other way too: a comfortable SDI result does not certify that an upstream polymer is compatible with the membranes. It is a filter-plugging index under its own test conditions — not a specific measurement of residual polymer and not a chemical compatibility assessment. The 0.45 µm rating belongs to the test filter and says nothing about what an RO membrane does with a dissolved molecule. Whether polymer carryover could meet an antiscalant or reach the membrane is a separate investigation, covered in PAM before reverse osmosis: carryover and antiscalant compatibility.
For the surrounding decisions, our industrial water reuse pretreatment selection guide covers what each stage has to achieve, and the jar test procedure guide covers bench dose selection, where turbidity rather than SDI is the working indicator.
Frequently Asked Questions
Can I convert turbidity in NTU into SDI15?
No. These sources establish no conversion, and none follows from the definitions: SDI is calculated from filter-plugging times a turbidimeter does not produce. Record both separately, with the sampling point and conditions for each. If someone hands you an SDI figure derived from a turbidity reading, ask for ti, tf and T — without them there is nothing to check.
What is the difference between tf and the 15 in SDI15?
Different quantities in different units. tf is a duration in seconds: how long it takes to collect the specified 500 mL sample after the elapsed filtration period. The 15 is that elapsed period T, in minutes, which is what the subscript records. In example A, tf was 60 seconds while T was 15 minutes.
Does a good SDI15 result prove my PAM is safe for RO?
No. It describes how a particulate and colloidal fouling index behaved under the test conditions used. It is not a specific identification or quantification method for residual polyacrylamide: the index does not tell you which chemical species are present or how much of any one of them there is, so it cannot stand in for assessing the exact chemical combination against the membranes in question. It is one input the membrane and project owner weigh alongside the chemical evidence.
Working from your actual test report
If you are screening polyacrylamide grades upstream of an RO train, send us the sampling point you measure at, the test report with its method conditions and time inputs, the grade you currently dose, and the treatment train the sample passes through. We will answer what the report supports and say plainly which questions it cannot settle. Start with our anionic polyacrylamide range or request a quotation with the report attached.
Sources
- DuPont FilmTec Reverse Osmosis and Nanofiltration Technical Manual (Form 45-D01504-en, Rev. 20, August 2026), section 2.5.1, pages 57–59. Covers the definitions of turbidity and SDI in the fouling-index table, the measurement apparatus and procedure, the SDI equation and its variable units, and the method note on the plugging fraction. Paraphrased; the figures and tables in that manual are not reproduced here.
- Toray Reverse Osmosis Membrane Element Operation, Maintenance and Handling Manual (06-G-MB1-260430, April 2026), section TMM-220, page 21, and section TMM-230 Operation Monitoring, pages 29, 31 and 33. Used for the practice of logging SDI15 and turbidity as separate feedwater parameters alongside operating data, and for the fact that feedwater parameter tables are presented per water category rather than as a single universal figure. Consult the guidance applicable to your own membrane specification.
- The reporting table and the three worked arithmetic examples are original editorial content prepared by ChinaPAM for this article. The examples are constructed numbers used to demonstrate the calculation, not measured results, product trials or acceptance criteria. The table is a reporting aid, not a manufacturer-issued or standards-body form.