
Short answer: a micropolymer retention and drainage trial is only as good as its design, and a weak design will hide whatever the chemistry is doing. Before you run it, fix three things: a stable baseline period with the wet end unchanged, one variable per step with enough time at each step to see a real response, and a written acceptance matrix agreed with the mill before the first drum arrives. Then test addition point and shear before you change grade — they are the cheaper and faster variables to move, and their effect on your machine is measurable within the same trial.

Illustrative paper-machine context. This image does not depict a trial described in this article and is not evidence of a ChinaPAM machine trial result.
Map the system before you pick chemistry
“Micropolymer” is used loosely in the market, and that is a procurement risk before it is a technical one. Suppliers use “micropolymer”, “microparticle” and “structured polymer” to mean different things, so the label on a quotation tells you very little on its own. Require the trial sheet to name, for each component in the proposed programme: its chemistry, its charge role in the programme, whether the stated dose is on a solids or an active basis, its position in the addition sequence, and its addition point. Two proposals cannot be compared until that is written down. Whether any of it helps you then depends on what your wet end is currently doing, so write the system down first:
- Furnish — virgin/recycled ratio, filler type and target ash, broke fraction and how broke is fed.
- Wet-end chemistry already present — coagulant or PAC feed and split, starch, sizing, fixatives, defoamer.
- Charge and conductivity — cationic demand and conductivity at the thin stock, measured over a shift rather than once.
- Addition points and the shear between them — fan pump, screen, headbox, and how many shear events sit between each dosing point and the wire.
- Machine constraints — vacuum capacity, press and dryer limits, current speed and the actual bottleneck. If the machine is dryer-limited, better drainage may not convert into speed.
This map determines what a good result even looks like. A mill that is dryer-limited should be measuring retention and sheet quality, not machine speed. A mill that is vacuum-limited may convert drainage gains directly into speed. Deciding this afterwards is how trials become arguments.
Baseline: the part most trials skip
You cannot measure an improvement against a moving reference. Before the trial, hold the wet end unchanged and log a baseline long enough to capture normal variation — grade changes, shift changes, broke swings and furnish variability all need to be inside the baseline window, not discovered during the trial.
Log at minimum: first-pass retention and first-pass ash retention, headbox and tray consistency, drainage indicator (vacuum levels, dry line position, or a standardised drainage test), wet-end charge and conductivity, sheet formation, breaks per day, sheet defects and deposit observations, and current chemical feed rates with the actual cost per tonne of paper. Without the last item you cannot judge a programme change commercially even if it works technically.
Addition point and shear: change these first
A multi-component programme is defined as much by where each component goes in as by what it is. The order and the shear between additions decide whether flocs formed by one component survive to the wire or are destroyed before they get there.
The general principle is that a high molecular weight flocculant added ahead of high shear loses part of its structure, while a structured or microparticle component is often intended to reform structure after that shear. So the practical trial sequence is:
- Confirm the current injection points and the shear events after each one. Count pumps, screens and cleaners between the dosing point and the headbox slice.
- Test moving the last component later — after the screen rather than before it — holding dose constant. This costs nothing in product and is worth testing early for that reason.
- Test splitting a feed rather than increasing it. Split coagulant or split flocculant feed changes the charge and floc history without changing total consumption.
- Only then change grade or programme type. If you change grade and addition point together you will not know which one produced the result.
Make-down matters as much as injection. Under-dissolved polymer gives an apparent dose response that is really a dissolution response, and over-sheared polymer at make-down cannot be recovered by adding more. Our dissolving method guide covers the make-down conditions that need to be fixed and logged before any dose comparison is meaningful.
One-variable trial ladder
| Step | Variable changed | Hold constant | Decide on |
|---|---|---|---|
| 0 — Baseline | Nothing | Entire wet end | Normal range and variability of every KPI |
| 1 — Make-down | Make-up concentration, ageing time, mixing energy | Grade, dose, injection point | Whether the current dose response is really a dissolution artefact |
| 2 — Injection point | Position of the last component relative to the screen | Grade, dose, make-down | Retention and formation at unchanged cost |
| 3 — Feed split | Split ratio of coagulant or flocculant | Total dose, grade, points | Charge stability and ash retention |
| 4 — Dose ladder | Dose of one component, three to four levels | Everything else | Where response flattens or formation degrades |
| 5 — Programme change | Micropolymer or microparticle position added/substituted | Best settings found in steps 1–4 | Full KPI set against baseline, plus cost per tonne |
| 6 — Confirmation | Nothing; repeat the winning condition | Winning condition | Whether the gain repeats across shifts and grades |
Step 6 is not optional. A single-shift gain that does not repeat across a grade change and a broke swing is not a programme result, and a trial that “worked” once can fail to hold through the first month of normal production for exactly that reason.
KPI and acceptance matrix
Agree this table with the mill before the trial, including who reads each number and how often. The right-hand column is what stops a trial being declared a success on one metric while another quietly degrades. Write the stop limits as mill-agreed numbers measured against a matched baseline period, not as generic thresholds: what counts as a real deviation depends on your own baseline variability and your quality specification. Safety and sheet-break risk are the exception — those revert immediately rather than against a limit.
| KPI | How measured | Must not degrade |
|---|---|---|
| First-pass retention | Headbox vs tray consistency, same sampling points each time | Formation, breaks |
| First-pass ash retention | Ash on headbox and tray samples | Sheet strength at target ash, two-sidedness |
| Drainage | Vacuum levels, dry line position, or a standardised drainage test held constant in method | Formation, wire wear, deposit rate |
| Formation | Formation tester or consistent visual/optical method | Retention gains must not be taken from formation |
| Sheet defects and deposits | Defect counts, web inspection, wire/felt observations | Mill-agreed stop limit against the matched baseline count; treat as a stop condition, not a trade-off |
| Breaks | Breaks per day against baseline window | Mill-agreed stop limit against the matched baseline; any sheet-break risk requires immediate reversion regardless of limit |
| Wet-end charge and conductivity | Same instrument, same sample point, logged per step | Check charge drift first when a trial looks “unstable”; log it per step so it can be ruled in or out |
| Programme cost per tonne | All wet-end chemical feed rates × price ÷ production | A retention gain bought with a larger cost increase is not a win |
A published case, and what it does and does not transfer
Solenis publishes a retention and drainage success story describing a Southern US machine producing 1,050 TPD of uncoated freesheet. In Solenis’s account the programme used structured silica, a structured polymer, an anionic polyacrylamide and a split PAC feed, and Solenis reports a 12% programme-cost reduction, an OME improvement from 96 to 99.1, and first-pass ash retention in the high 60s.
Those are Solenis’s reported results for Solenis’s programme on that mill. They are cited here for two reasons only: they show the multi-component architecture (coagulant split plus flocculant plus structured components) that this kind of programme uses in practice, and they show which KPIs a mill actually accepted as evidence. Neither the percentage nor the OME figure transfers to another machine, and ChinaPAM has not reproduced that case. Furnish, filler, charge demand, machine configuration and starting programme all differ between mills, which is exactly why the trial ladder above exists.
The transferable lesson is architectural: cost reduction in that account came from restructuring the programme and the feed points, not from a single cheaper product. That is where a micropolymer position is usually justified or ruled out.
Failure modes and stop conditions
| Symptom during trial | Probable cause | Next action |
|---|---|---|
| Retention up, formation visibly worse | Flocculation too aggressive or too early; floc too large at the slice | Move the last addition later, or reduce dose before changing grade |
| Response drifts away within a shift | Charge or conductivity drift, broke swing, or make-down inconsistency | Log charge per hour; check make-down concentration and ageing time before re-dosing |
| No response to a clear dose increase | Under-dissolved polymer, or shear destroying structure downstream of the injection point | Verify dissolution, then move injection point; do not keep climbing dose |
| Ash retention up, strength down | Filler retained as poorly bonded agglomerates | Re-check target ash with the mill; treat as a specification question, not a chemistry fix |
| Deposits or wire fouling appear | Overdose, incompatibility with an existing additive, or charge overshoot | Stop condition. Return to baseline settings and review compatibility before resuming |
| Breaks increase | Formation or wet-web strength affected | Stop condition. Revert immediately; no retention gain justifies it |
| Gain does not repeat next shift | Result was inside normal variability, or an uncontrolled variable moved | Return to step 6 and repeat before drawing any conclusion |
What bench screening proves and cannot prove
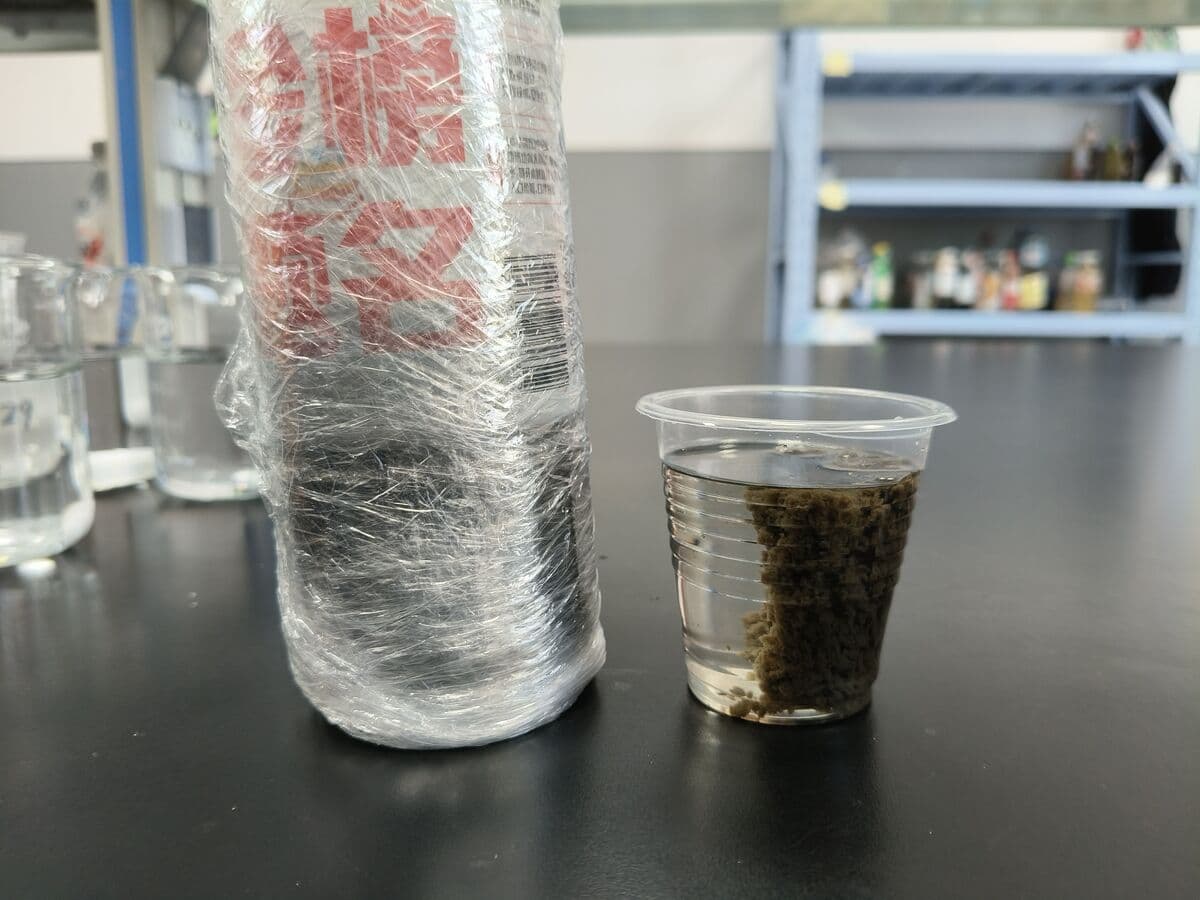
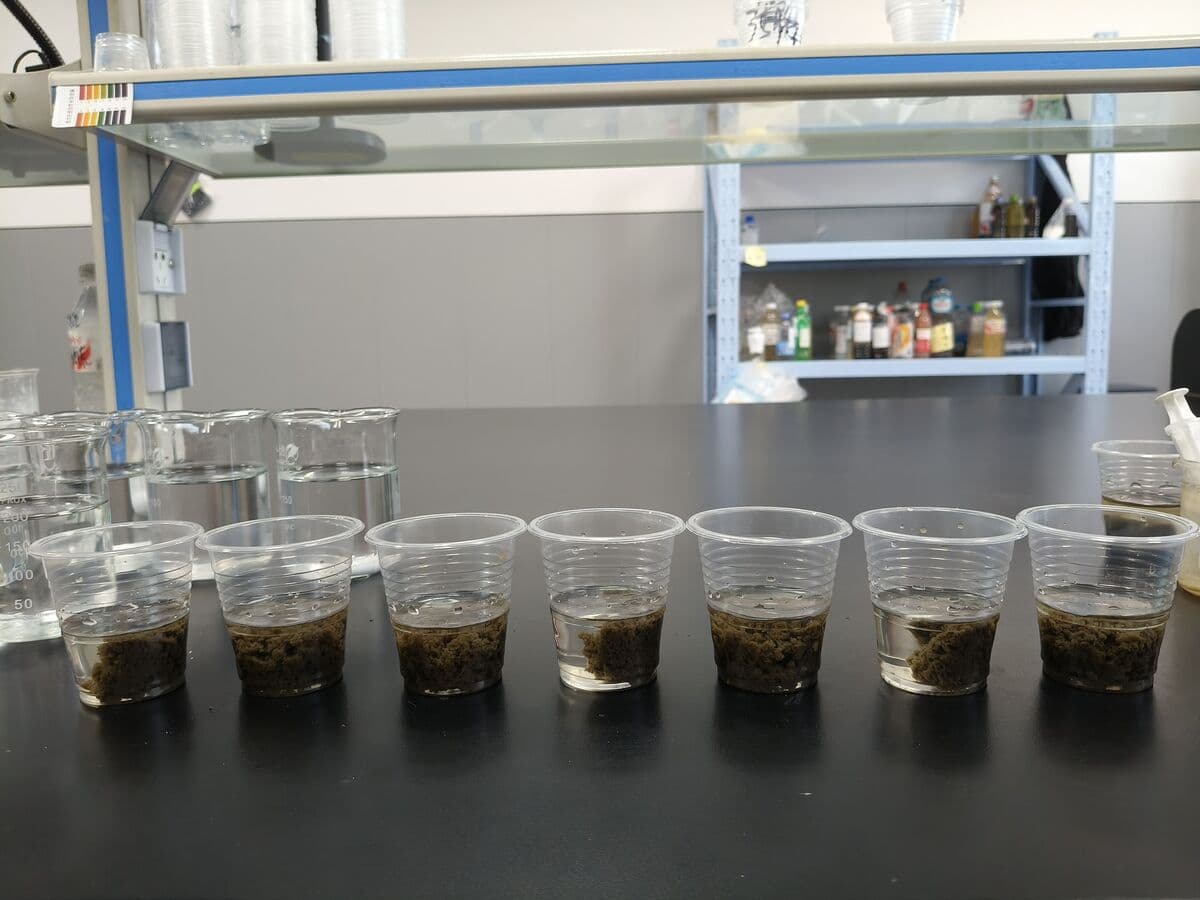
Visual screening example on a paper mill water sample. This is a bench comparison used to narrow candidates — it is not machine-trial proof and does not represent wet-end retention performance.
Bench work can: rule out chemistries that give no floc or immediate overdose behaviour on your water; rank a short list for charge compatibility against measured cationic demand; expose dissolution and make-down problems cheaply; and confirm that two candidate products behave differently at all before machine time is spent. Our jar test procedure sets out a repeatable method.
Bench work cannot: reproduce wire-section dewatering, headbox shear history or vacuum-assisted drainage; predict first-pass retention on a running machine; predict formation, sheet defects or breaks; or establish a programme cost per tonne. Those require the machine trial, which is why the bench stage should be kept short and used only to shorten the candidate list.
What to send with the enquiry
A candidate short list can be put together from the following. The more of it you can send, the fewer machine-trial steps are wasted on questions that could have been answered on paper:
- Machine type, grade produced, basis weight range, speed and production rate.
- Furnish composition, filler type and target ash, recycled fraction and how broke is handled.
- Wet-end additives already in use, with feed points and current feed rates.
- Measured cationic demand and conductivity at the thin stock, ideally across a shift.
- Current first-pass and first-pass ash retention, and the drainage indicator you rely on.
- Which constraint you are actually trying to relieve — drainage, retention, ash, cost per tonne, or a specific defect.
- Whether the machine is drainage-limited, press-limited or dryer-limited, since that determines whether a drainage gain converts into anything.
- Any additive you cannot change, and any product family excluded by the mill.
For the application background behind these programmes see our retention and drainage solution page, the broader paper-making solutions overview and the paper-making application page. For product-level context on the polymer positions referred to above, see our retention aid guide and the general PAM in paper-making overview.
Sources
- Solenis success story — retention and drainage programme on a Southern US 1,050 TPD uncoated freesheet machine; Solenis reports structured silica, structured polymer, APAM and split PAC feed, a 12% programme-cost reduction, OME from 96 to 99.1 and first-pass ash retention in the high 60s. Results are Solenis’s, for that mill and that programme: solenis.com — retention & drainage programme case
- Solenis success story — control of headbox fines through particle management, cited for the particle-management architecture only: solenis.com — headbox fines case
- TAPPI — standards and test-method context for retention, ash and drainage measurement: tappi.org
Third-party case results above are attributed to their publisher and describe that publisher’s own programme at a specific mill. They are not ChinaPAM results and are not presented as transferable outcomes. Doses, ladders and matrices in this article are an initial test framework to be set against your own machine data, not a promised operating range. Bench screening narrows candidates; machine conditions control the final choice.
Get a candidate short list and a trial ladder for your machine
Send the machine data, furnish, current wet-end programme with feed points, measured charge and conductivity, and the constraint you are trying to relieve. We will propose a candidate short list, a one-variable trial ladder and an acceptance matrix to agree with the mill before any product ships, and confirm sample options and quotation for that duty.
Quotation based on grade, quantity and destination · info@chinapolyacrylamide.com · WhatsApp +86 187-3759-0940